

HeatMap Visual
The latest Version of EBI’s Smart-UI has been released.
We have added the Heat Map Visual control – this is accessed from within the Dynamic View in the Visualisations area:
HeatMap Visual
The Heat Map can be be set to display its Cell background with either solid colours, or with a colour gradient (both target dependant)
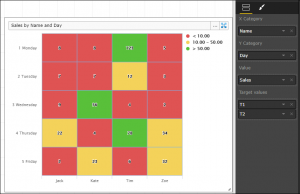
HeatMap Visual – Solid Colours
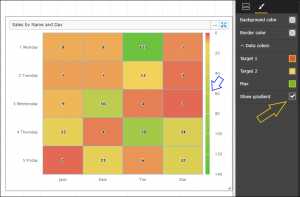
HeatMap Visual – Colour Gradient
The Target Values can be taken from a different Smart Table than the Actual Values, and the two Smart Tables don’t need to be joined for this to happen.
This is very useful in a variety of business models, from FMCG, through membership and indeed into any business which requires an immediate and easy view of performance against targets