

Would you like to see your performance against budgets at a glance ?
Using our Heat Map Visual will enable you to see, at a glance, how your company or department is doing against your targets and budgets.
Information Delivered™
Using our Heat Map Visual will enable you to see, at a glance, how your company or department is doing against your targets and budgets.
The latest version of EnhancedBI has been released. The changes are: – added the ability for HeatMap Visuals to be filtered using KPI Visuals, Table Visuals and Search Visuals – added the ability for KPI Visuals to be filtered using Table Visuals and Search Visuals – enhanced checking in EPs for exporting nulls instead of…
Read more
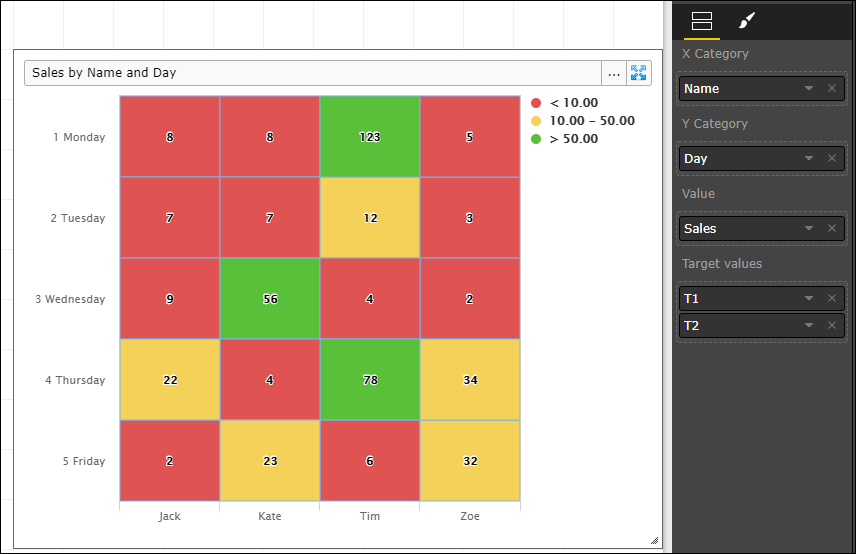
The latest Version of EBI’s Smart-UI has been released. We have added the Heat Map Visual control – this is accessed from within the Dynamic View in the Visualisations area: The Heat Map can be be set to display its Cell background with either solid colours, or with a colour gradient (both target dependant) The…
Read more